How to use this resource
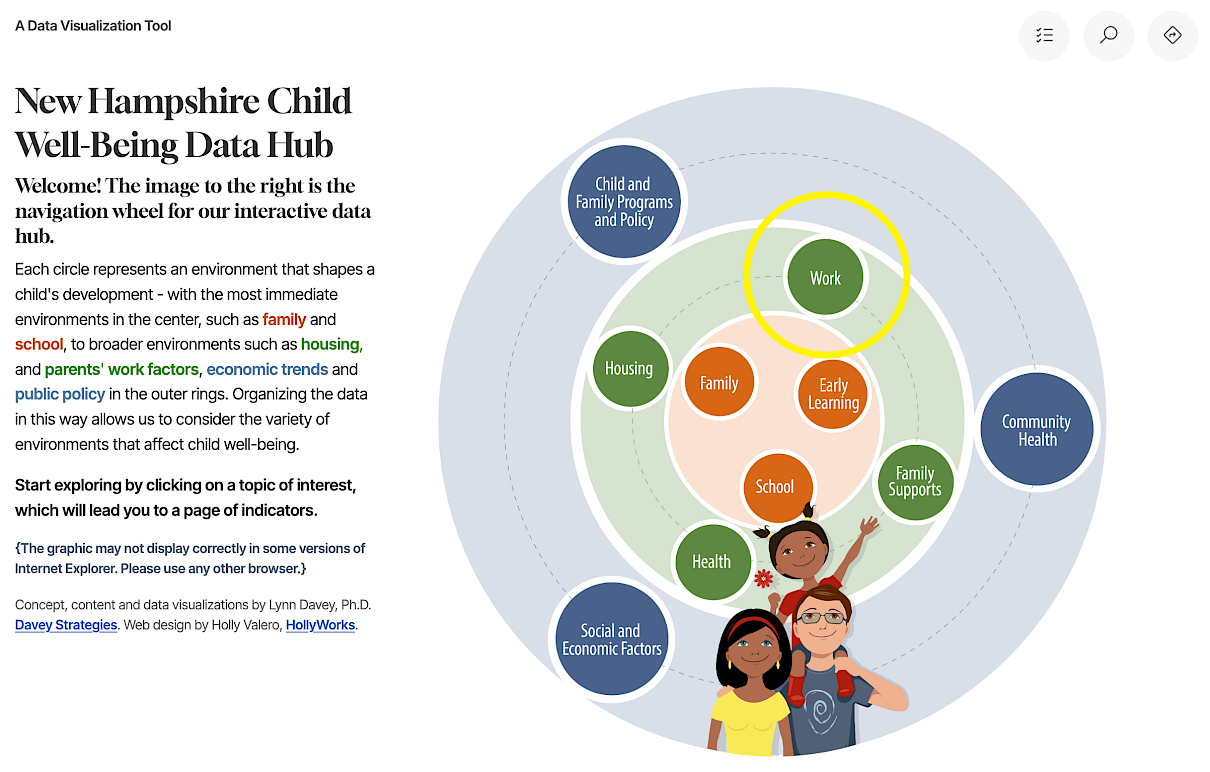
Explore the graphic navigation for clickable links
These will take you to the section clicked. You can also use the list button at the top right of any page to slide out a full list of available pages.
Choose a specific topic in the section to see the data

The charts are interactive.
Hovering over a data point will bring up a box with more information. As you explore you'll find that bar and column graphs can be resorted by value, or county name. Many larger charts have multiple views that you can page through.
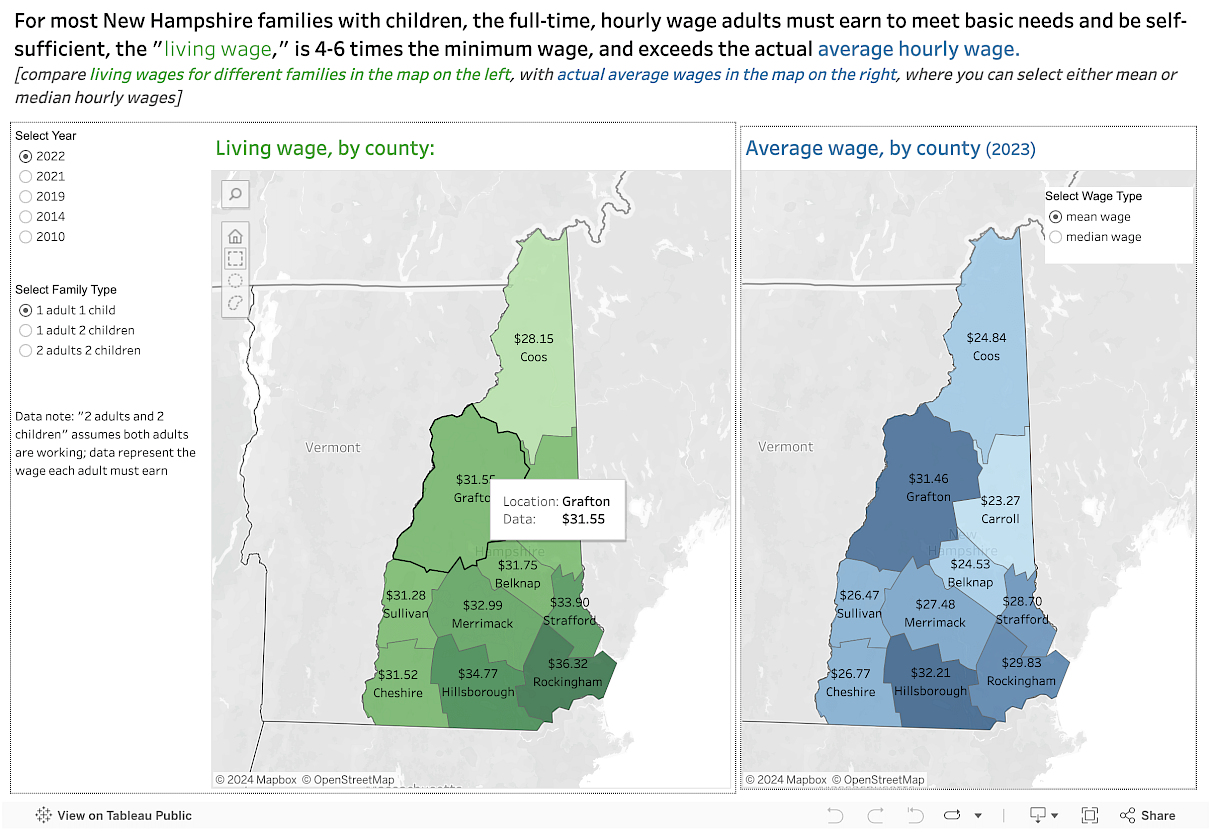
Tableau Charts are interactive!
You will see a Tableau footer below the chart. On the lower left you will see buttons for undo, redo, and reset which will be useful if you have been sorting or selecting data on the chart.

You will also notice, on the lower right, that you can share the visualization with others, shift to full screen. The Download menu will let you download the chart in image or PDF, or download the original data. Note that you must click within the chart itself before the “data” option will be visible in the Download menu.